On-site search is an important navigational tool for ecommerce and content-based websites. When a large amount of content exists on a site, complex navigation can be inescapable, making it difficult for users to find their way around the site. On-site search is frequently chosen as the best option to help simplify user experience.
But what can we learn from the data that comes from your users’ on-site searches? What kind of insights does this search data provide, and how can you use this information to increase engagement and conversions?
Which search data are we talking about?
On-site search is a common feature, especially for websites selling products or containing large amounts of content. A study of 21 e-commerce sites showed that they had an average usage rate of 5.75% for their on-site search functionality. However, these rates varied significantly, with the lowest being 1% and the highest being 18%. When on-site search was used, however, conversion rates were high at 4.63%, versus the overall average of 2.77% – 1.8 times better.
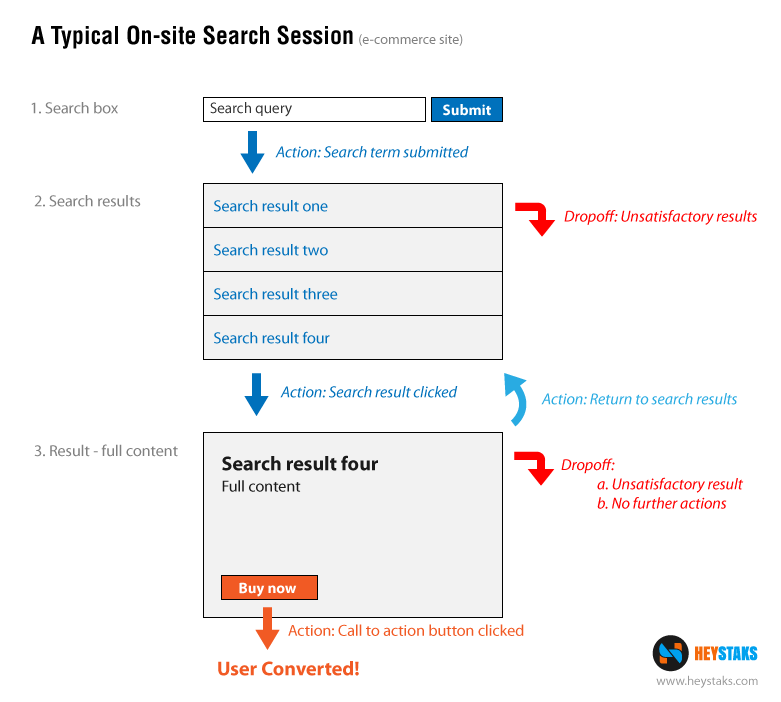
A typical on-site search session will usually consist of the following stages:
-
The user submits their search term, using a search input box.
-
The search system returns a result page, containing collection of pages which have some relevance to the search query. Results are generally sorted by relevance.
-
If any of the results appear interesting or relevant to the user, they will select that result to view its full content. If no results were interesting/relevant, the user will either modify their search query and resubmit, hoping to get better search results, or exit the search session.
-
When full content is viewed:
-
If the chosen content is not satisfactory, the user may return to results page to look for another relevant result.
-
User exits session if content is not satisfactory
-
User exits session because the content satisfied their original need and there are no further steps to take
-
User completes a conversion if further calls to action are present (such as an ‘Add to Cart’ button).
-
Metrics which can be measured through data analysis are as follows:
-
Queries searched for and number of times submitted
-
Number of users submitting search queries
-
Number of results returned for a given search query (Including queries with no results)
-
Click-through stats for each result shown, and the refering search query
-
Number of dropoffs (no clicks) from result list pages
-
Number of dropoffs from content pages that were reached through on-site searches
Insights that can be gained from search data analysis
When the data from all search sessions is combined, some analysis can reveal telling information about your users, and lead to informed actions to increase website conversions and provide a better user experience.
Customer preferences
Monitoring the number of hits to any page of a website using general usage stats can give us an idea about how popular that content is. Analysing the number of hits to pages that start with a search can show which content is most frequently found by a direct need, rather than by indirect browsing behaviour. This can inform decisions on how to stimulate conversions.
We can also find affinities between products or content by identifying groups of search queries that are commonly searched for by similar users. This gives insight into which products or content to recommend next to a user. We can also expose random affinities – that is common patterns of user interests that are unexpected and have no semantic connection. For example, a Facebook data analysis project identified that Britney Spears fans are more likely to use colon-cleansing products. Lovely.
Grouping users by interest
As users search and select results, they are implicitly expressing areas in which they have some level of interest. When other users search for the same queries and select the same results, we can deduct that there is a degree of similarity between those users. Based on the number of overlapping searches, the strength of relationship between users can be calculated, and meaningful communities of users can be formed. These insights can be used to pre-empt the user’s next step to improve usability, or to recommend content that we know the user is likely to find valuable.
Search success rates
We can examine the data to find search success rates. A successful search can be defined as a search for which there is a corresponding click on at least one result. A failed search will have no corresponding clicks, and may or may not have results returned at all.
The percentage of successful searches can be calculated for:
-
All search queries by all users
-
One search query by all users
-
All search queries by one user
Search success rates can help expose:
-
Searches for products or content that does not exist on the site
-
Where synonyms could be added to provide better search coverage
Search trends and time-sensitive search activity
By analysing the changing nature of queries over time, and by viewing metrics in time-restricted chunks, trends in interest in particular items can be found for different periods. If a trend is identified in its early stages, positive actions can be defined to take advantage of the surge in interest.
How can HeyStaks help?
We make products that are dedicated to analysing search data and making search experiences more relevant and personalized.
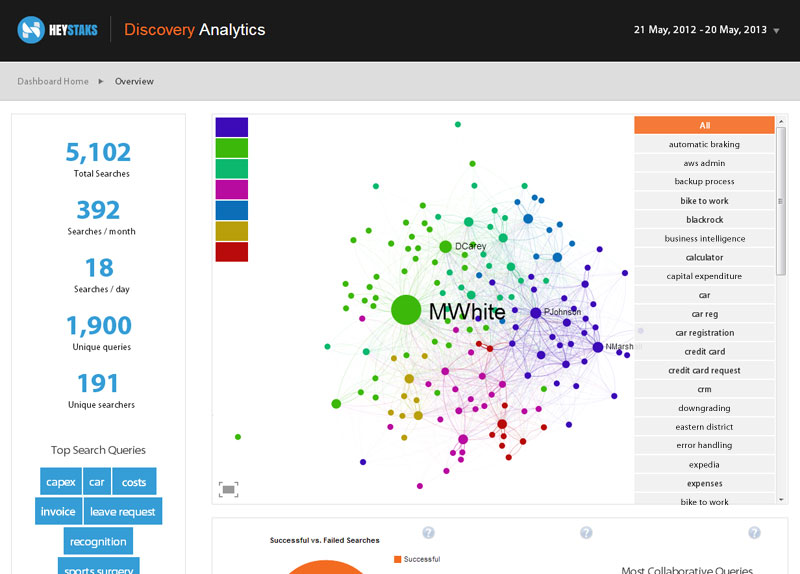
HeyStaks Discovery Analytics learns from your search data to build an interface that visualizes what your users are searching for and finding, and how they’re doing it. It automatically groups users into communities based on similarity and gives insight into the search topics which are most popular for each group. Learn more
HeyStaks Collaborative Search can be added to any search system to allow users to collaborate effortlessly. When a user performs a search, they’ll be shown the results which have been selected by similar users for the same search. This makes the search result page more relevant and personalized and leads to improved conversions. Learn more


